A Visium atlas of the whole catalog#
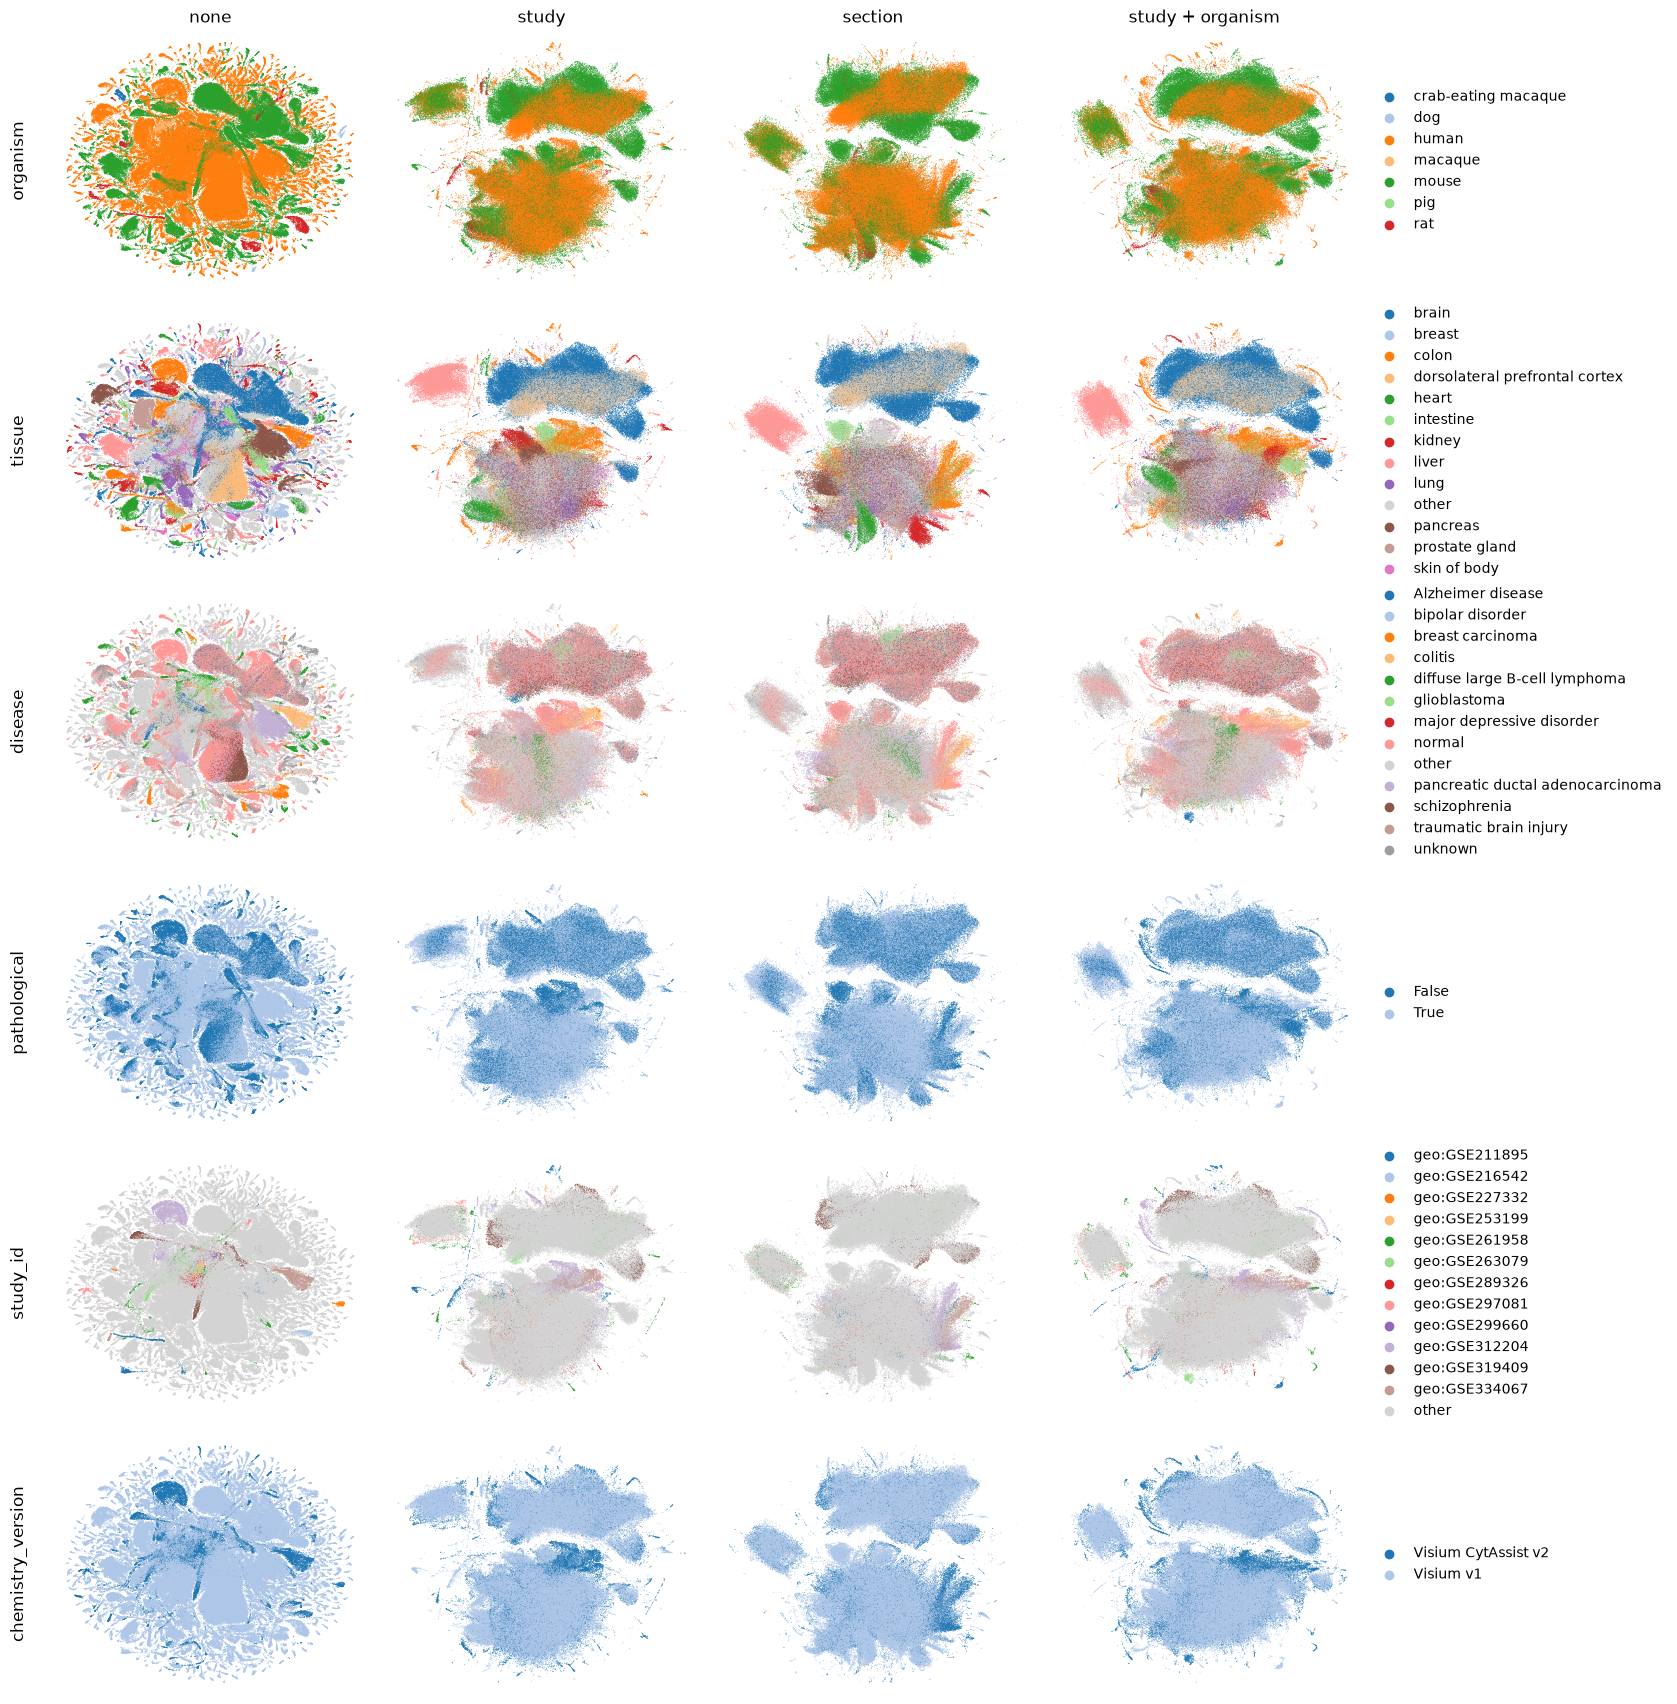
This guide pulls every Visium Spatial Gene Expression table in the catalog (about 4,000 tissue sections from 7 mammals), puts them in one shared human gene space, and integrates them on a GPU with rapids-singlecell. The question: after integration, do the spots cluster by species or by organ?
Only the count tables are read — no images, no shapes. The run needs an NVIDIA GPU with a lot of
memory (we used one B300, 288 GB) and ~1.5 TB host RAM; the outputs below are from that run. CUDA 13 needs
an Ampere or newer GPU (no V100). The
environment is in pixi.toml next to this notebook (pixi run jupyter lab on a GPU node).
import os
from pathlib import Path

import anndata as ad
import cupy as cp
import matplotlib.pyplot as plt
import numpy as np
import pandas as pd
import rapids_singlecell as rsc
import rmm
import scanpy as sc
import scipy.sparse as sp
from rmm.allocators.cupy import rmm_cupy_allocator

import sddb

WORK = Path(os.environ.get("ATLAS_WORK", "."))  # large intermediates land here
CATALOG_VERSION = "2026-10-22"  # pinned so the cohort is reproducible
1. The cohort#
Plain Visium only (no Visium HD, no legacy ST arrays) from a pinned catalog release. Zebra finch is left out: a bird shares too few one-to-one orthologs with human to sit in the same gene space.
catalog = sddb.Catalog(version=CATALOG_VERSION)
visium = catalog.query(validation=None, assay="Visium Spatial Gene Expression")
visium = visium.where(visium.members["organism"] != "zebra finch")
if n := int(os.environ.get("ATLAS_N", 0)):  # smoke-test on a random subset
    visium = visium.where(visium.members["uid"].isin(visium.members["uid"].sample(n, random_state=0)))
members = visium.members
print(len(members), "datasets")
members["organism"].value_counts()
4008 datasets
organism
human                  2397
mouse                  1474
rat                      85
macaque                  22
crab-eating macaque      18
pig                       8
dog                       4
Name: count, dtype: int64[pyarrow]
2. One gene space: human one-to-one orthologs#
Datasets list genes as Ensembl IDs (either as the index or in var["gene_ids"]). Non-human genes are
renamed to their human one-to-one ortholog from Ensembl Compara release 116, and every section keeps only
the human genes that have such an ortholog in all species of the cohort. The few datasets that carry gene
symbols only are skipped and counted below.
COMPARA = "https://ftp.ensembl.org/pub/release-116/tsv/ensembl-compara/homologies/{sp}/Compara.116.protein_default.homologies.tsv.gz"
SPECIES = {
    "mus_musculus": "mouse",
    "rattus_norvegicus": "rat",
    "macaca_mulatta": "macaque",
    "macaca_fascicularis": "crab-eating macaque",
    "canis_lupus_familiaris": "dog",
    "sus_scrofa": "pig",
}


def one2one(dump: str) -> pd.DataFrame:
    """Human one-to-one orthologs from a Compara dump (row order is arbitrary, so read both directions)."""
    cols = ["gene_stable_id", "species", "homology_type", "homology_gene_stable_id", "homology_species"]
    d = pd.read_csv(dump, sep="\t", usecols=cols)
    d = d[d["homology_type"] == "ortholog_one2one"]
    fwd = d[(d["species"] == "homo_sapiens") & d["homology_species"].isin(SPECIES)]
    rev = d[(d["homology_species"] == "homo_sapiens") & d["species"].isin(SPECIES)]
    return pd.concat(
        [
            pd.DataFrame(
                {
                    "sp": fwd["homology_species"],
                    "gene_id": fwd["homology_gene_stable_id"],
                    "human": fwd["gene_stable_id"],
                }
            ),
            pd.DataFrame(
                {"sp": rev["species"], "gene_id": rev["gene_stable_id"], "human": rev["homology_gene_stable_id"]}
            ),
        ]
    )


orth_path = WORK / "one2one_ensembl116.parquet"
if not orth_path.exists():
    # Mouse sits in its own dump; every other species is in the human one.
    orth = pd.concat([one2one(COMPARA.format(sp="homo_sapiens")), one2one(COMPARA.format(sp="mus_musculus"))])
    orth = orth.assign(organism=orth["sp"].map(SPECIES)).drop_duplicates(["organism", "gene_id"])
    orth[["organism", "gene_id", "human"]].to_parquet(orth_path, index=False)
orth = pd.read_parquet(orth_path)
# Ensembl IDs are unique across species (ENSMUSG…, ENSRNOG…), so one lookup serves every section. This also
# covers sections aligned to a neighbouring genome (a few rat sections were aligned to mouse).
to_human = pd.Series(orth["human"].to_numpy(), index=orth["gene_id"].to_numpy())
# Only human genes with a one-to-one ortholog in *every* species of the cohort: a gene missing in one species
# would read as zero there and HVG selection would pick up species instead of biology.
shared = set.intersection(*(set(g["human"]) for org, g in orth.groupby("organism") if org in set(members["organism"])))
print(len(shared), "shared genes")
12162 shared genes
3. Read, map and QC every table#
The mapping and QC go into a TableAdapter: to_anndata reads the members in parallel and runs each
table through the adapter as it arrives, so the full gene matrix of every section never sits in memory at
once. The adapter skips sections without Ensembl IDs, keeps in-tissue spots, maps genes to the shared
human space, and applies light fixed QC: spots need ≥200 detected genes and sections need ≥100 spots
left. Every skipped section is listed with its reason in uns["sddb"].
class OrthologAdapter:
    """Map a Visium table onto the shared human one-to-one ortholog genes, with light QC."""

    name = "visium-human-orthologs"
    version = "1"

    def requirements(self) -> dict:
        return {"elements": ("X", "obs", "var")}  # skip duplicate count layers

    def validate_meta(self, row: pd.Series) -> list[str]:
        return []

    def validate(self, adata: ad.AnnData, row: pd.Series) -> list[str]:
        return [] if self._ensembl(adata).notna().mean() >= 0.5 else ["gene symbols only"]

    def build(self, adata: ad.AnnData, row: pd.Series) -> ad.AnnData | None:
        ens = self._ensembl(adata)
        if "in_tissue" in adata.obs:
            adata = adata[adata.obs["in_tissue"].astype(int) == 1]
        X = sp.csr_matrix(adata.X, dtype=np.float32)
        human = ens.where(ens.str.startswith("ENSG", na=False), ens.map(to_human))
        human = human.where(human.isin(shared))
        keep = (human.notna() & ~human.duplicated()).to_numpy()  # ponytail: mixed-species refs keep the first copy
        out = ad.AnnData(
            X=X[:, keep], obs=pd.DataFrame(index=adata.obs_names), var=pd.DataFrame(index=human[keep].to_numpy())
        )
        out = out[np.asarray((out.X > 0).sum(axis=1)).ravel() >= 200].copy()
        return out if out.n_obs >= 100 else None

    @staticmethod
    def _ensembl(adata: ad.AnnData) -> pd.Series:
        ids = adata.var["gene_ids"] if "gene_ids" in adata.var else adata.var_names.to_series()
        # Multi-genome references prefix IDs (``GRCh38_ENSG…``); version suffixes (``.12``) are dropped too.
        return pd.Series(ids.astype(str).str.extract(r"(ENS[A-Z]*G\d{11})")[0].to_numpy())


COVARIATES = [
    "organism",
    "tissue",
    "disease",
    "pathological",
    "chemistry_version",
    "preservation_method",
    "development_stage",
]
atlas_path = WORK / "visium_counts.h5ad"
pca_path = WORK / "visium_pca.h5ad"  # written in step 4; when present, the counts are not needed again
if pca_path.exists():
    adata = None
elif atlas_path.exists():
    adata = ad.read_h5ad(atlas_path)
else:
    adata = visium.to_anndata(obs_columns=COVARIATES, adapter=OrthologAdapter(), max_workers=32)
    adata.write_h5ad(atlas_path)
report = (adata if adata is not None else ad.read_h5ad(pca_path, backed="r")).uns["sddb"]
dropped = pd.Series(report["dropped"], name="reason", dtype=str)
print(
    f"{len(members) - len(dropped):,} of {len(members):,} sections kept ({report['adapter']} v{report['adapter_version']})"
)
dropped.value_counts()
3,954 of 4,008 sections kept (visium-human-orthologs v1)
reason
gene symbols only                          35
dropped by visium-human-orthologs.build    19
Name: count, dtype: int64
4. Preprocessing on the GPU#
Everything from here runs in rapids-singlecell. RMM managed memory lets the GPU oversubscribe into host RAM, so the whole ~10 M-spot matrix moves to the GPU at once — the same setup as the Tahoe-100M analysis.
rmm.reinitialize(managed_memory=True)
cp.cuda.set_allocator(rmm_cupy_allocator)

if pca_path.exists():
    adata = ad.read_h5ad(pca_path)
else:
    rsc.get.anndata_to_GPU(adata)
    rsc.pp.normalize_total(adata, target_sum=1e4)
    rsc.pp.log1p(adata)
    rsc.pp.highly_variable_genes(adata, n_top_genes=3000)
    adata = adata[:, adata.var["highly_variable"]].copy()
    rsc.pp.pca(adata, n_comps=50)
    # From here on only the embedding is needed: keep obs, uns and PCA, drop the expression matrix.
    adata = ad.AnnData(
        obs=adata.obs,
        uns=adata.uns,  # keeps the adapter's skip report
        obsm={
            "X_pca": cp.asnumpy(adata.obsm["X_pca"])
            if isinstance(adata.obsm["X_pca"], cp.ndarray)
            else adata.obsm["X_pca"]
        },
    )
    adata.write_h5ad(pca_path)
adata
AnnData object with n_obs × n_vars = 10627469 × 0
    obs: 'uid', 'study_id', 'organism', 'tissue', 'disease', 'pathological', 'chemistry_version', 'preservation_method', 'development_stage'
    uns: 'sddb', 'log1p', 'hvg', 'pca'
    obsm: 'X_pca'
5. Integration variants#
Harmony on the PCA, with four batch definitions. Organ is never a batch key — removing it would erase the very signal we are looking for.
none: PCA only, the baseline.
study:
study_id(many GEO and HEST sections are their own study, so this is close to per-section).section: every dataset
uidis its own batch.study + organism: additionally forces the species to mix; do organ clusters survive?
VARIANTS = {"none": None, "study": ["study_id"], "section": ["uid"], "study + organism": ["study_id", "organism"]}
adata.obs["study_id"] = (
    adata.obs["study_id"].astype("string").fillna(adata.obs["uid"].astype("string")).astype("category")
)
adata.obs["uid"] = adata.obs["uid"].astype("category")

for name, keys in VARIANTS.items():
    rep = "X_pca"
    if keys:
        rep = f"X_harmony_{name}"
        rsc.pp.harmony_integrate(adata, key=keys, basis="X_pca", adjusted_basis=rep)
    # `all_neighbors` builds the whole kNN graph in one pass (~2 min for 10 M spots); brute force is quadratic.
    rsc.pp.neighbors(adata, use_rep=rep, n_neighbors=15, algorithm="all_neighbors", key_added=f"nn_{name}")
    rsc.tl.umap(adata, neighbors_key=f"nn_{name}", key_added=f"X_umap_{name}")

rsc.get.anndata_to_CPU(adata)
adata.write_h5ad(WORK / "visium_atlas.h5ad")
6. Species or organ?#
One row per covariate, one column per integration variant. For legibility each panel shows a random 300 k spots and the 12 most common categories; the rest are grey (“other”), missing values are “unknown”.
# preservation_method (95 of 4,008 sections) and development_stage (none) are too sparse in the catalog to plot.
COLOR_BY = ["organism", "tissue", "disease", "pathological", "study_id", "chemistry_version"]
rng = np.random.default_rng(0)
show = adata[rng.choice(adata.n_obs, size=min(300_000, adata.n_obs), replace=False)].copy()
for col in COLOR_BY:
    values = show.obs[col].astype("string").fillna("unknown")
    top = values.value_counts().index[:12]
    show.obs[col] = values.where(values.isin(top), "other").astype("category")
    show.uns[f"{col}_colors"] = [
        "#d3d3d3" if c == "other" else "#9e9e9e" if c == "unknown" else plt.cm.tab20(i % 20)
        for i, c in enumerate(show.obs[col].cat.categories)
    ]

fig, axes = plt.subplots(len(COLOR_BY), len(VARIANTS), figsize=(4 * len(VARIANTS) + 4, 3.6 * len(COLOR_BY)))
for i, col in enumerate(COLOR_BY):
    for j, name in enumerate(VARIANTS):
        sc.pl.embedding(
            show,
            basis=f"X_umap_{name}",
            color=col,
            ax=axes[i, j],
            show=False,
            frameon=False,
            size=1,
            legend_loc="right margin" if j == len(VARIANTS) - 1 else None,
            title=name if i == 0 else "",
        )
    axes[i, 0].text(-0.08, 0.5, col, transform=axes[i, 0].transAxes, rotation=90, va="center", ha="right", fontsize=12)
fig.subplots_adjust(right=0.78, wspace=0.05, hspace=0.08)
fig.savefig(WORK / "visium_atlas_umaps.png", dpi=100, bbox_inches="tight")